UYGULAMALI ARAŞTIRMA YÖNTEMLERİ (SYLLABUS)
Yoklamada 7 imzada kalan öğrenci devam alamaz.
Sorular ve cevapları
1. Kuram, yapı, boyutlar hakkında bilgi. Bilgisayarlara SPSS yükleme talebi.
2. Araştırma türleri: tanımlayıcı, sonuç çıkarıcı, model geliştirme araştırmaları. Problem cümlesi, amaç, önem, kapsam, kısıtlar, ön kabuller, SPSS uygulaması (Anketlere ID numarası verme, Excell'de veri dosyası açma ve aktarma, değişkenlerin veri yapılarının kodlanması, negatif maddelerin tersine döndürülmesi, değişkenlere label atanması)
3. Hipotezler , SPSS uygulaması; SPSS (data screening Veri İncelemesi means checking data for errors and fixing or removing these errors -- Max-min analizi, uç değerler, outliers, boyutsal ve kompozit puanların hesaplanması. (toplam, ortalama ve faktör puanları temel alınarak) Boyutsal puanların demografik değişkenlere göre dağıtılması) Tavan, taban etkisi. Örneğin 10 maddeli ölçek için toplamlarını al. Transformada 40-50 arasını 1; 20den üçüğü 2 olarak ve 21 ila 39 arasını 3 olarak kodla frekansını al ve 1 ile 2 nin yüzdesinin %15'ten küçük olup olmadığına bak. Küçükse tavan-taban etkisi yok. 5 değil 7 dereceli ölçek kullanılması.
A completely different traditional approach would be to apply a transformation like square root, log, or inverse to try to make the data more normal. Square Root Transformation in SPSS
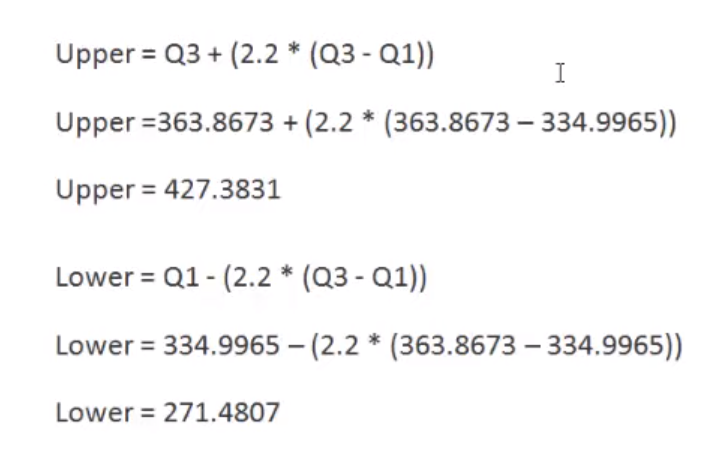
OUTLIERS
Tekli değişkenler için uç değerler box grafiği ile, çoklu değişkenler için uç değerler Mahalanobis D square ile
Regression/lineear menüsü ile
Bağımlı değişken stres / bağımsız değişken yaş faktörü --Save/mahalonobis/OK/ hesaplamayı yap... Maha…. verileri sütunu (d Square verileri)/ Çıktılardaki Anova tablosuna dönmemiz gerekiyor. Anova tablosundan serbestilik derecesine bakmamız gerekiyor (ki bizde 2)/ Transform/compute yeni değişken adı ver Pdegeri_forD --- Hesaplama penceresine 1- CDF.CHISQ(MAH_1,2) serbestlik derecesini yazıyoruz ok deyip hesaplıyoruz..... Sort ascendig ve p değeri 0,001'den küçük olanlar ayrık değer olarak atanır. Variable viev'de andalık hanesini 5'e çıkar ve incele. 0,001'den daha küçük değer olmadığı için ayrık değer olmadığına karar verilir. Daha sonra ….Transform-calculate -- rank/$rankcasenum / scatter x değişkeni rank y maha grafiğe çift tıkla vakaları belirle.
normallik değerlemesi
Additionally, there is an option to test for normality separately for individual groups. As in the example above, we could further investigate if the data for males and females is normally distributed.
A test of significance on "normality" is often very uninformative. With large samples
these tests almost always reject the hypothesis that sample data are from a normally
distributed population, but often the degree of non-normality is only small and has
no impact on the reliability of the statistcal analyses. Graphic methods such as q-q-
plots are often more useful. Moreover, if you perform analyses such as regression, ANOVA, t-test, then the normality of the variables is uninteresting. Instead, you would have to inspect
the distribution of the residuals (prediction errors). Even more: if you want to perform analyses such as regression, ANOVA, t-test, then with such a large sample size as yours, even a normal distribution of the residuals doesn't matter much.
http://www.talkstats.com/threads/non-normal-likert-scale-data.24598/
Normality Testing for Residuals in ANOVA using SPSS analyse/general linear model/ dependent stres/ faktör yaş *cinsiyet/save unstandardized/contineu Resudual adlı yeni bir değişken ve onun normal dağılım özelliği.
4. Hipotezler, SPSS uygulaması. normallik testleri: stem and leaf plots, normal Q-Q
Plot, box plot to determine the data skewness and kurtosis. A further manifestation of non-normality was noticed when Z-score value for each item was calculated. The verity of few cases has Z-value more than ±2 and spread over the variables. To curtail the occurrences of abnormal data in the current study the researcher decided that the data be transformed through cdfnorm. As a result after the transformation, the Skewness and Kurtosis of all the items are within the acceptable range of < 2 and < 7 respectively. For example the skewness values are all less than 1; similarly, the Kurtosis values on the other hand are less
than 2, an indication that the data is normal (see appendix III). This is in conformity with the suggestion forwarded by [2] that data transformation improves results of an abnormal data. Split file / Compare groups / descriptive analysis
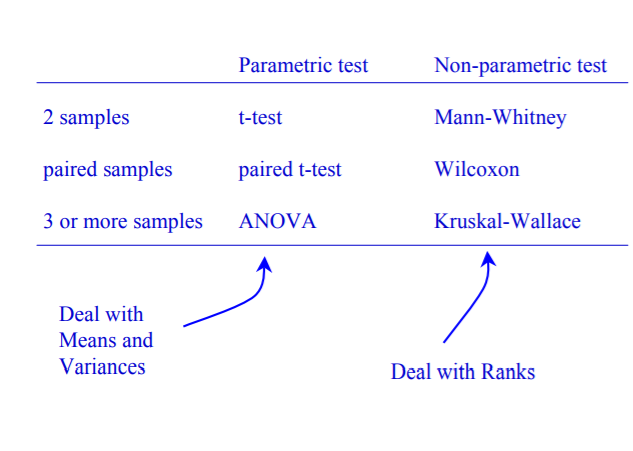
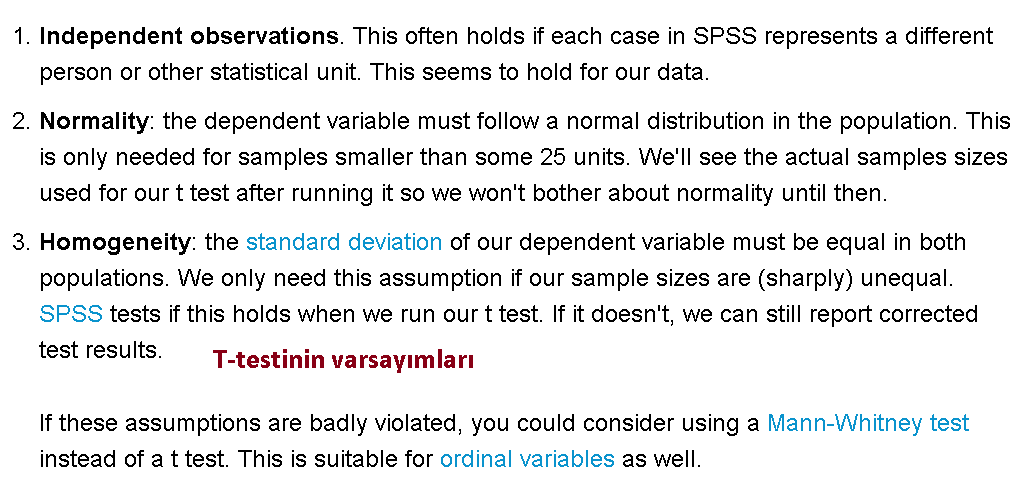
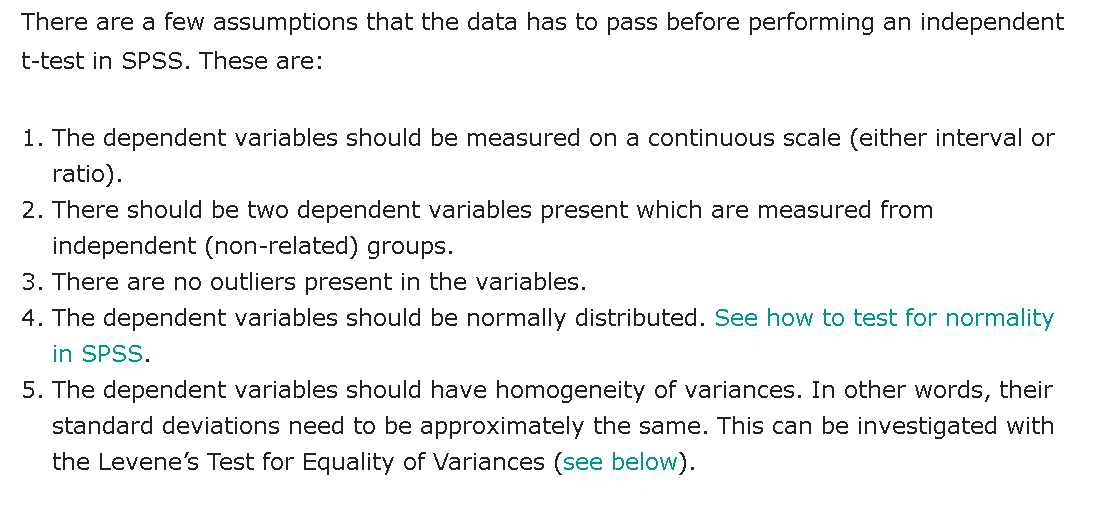
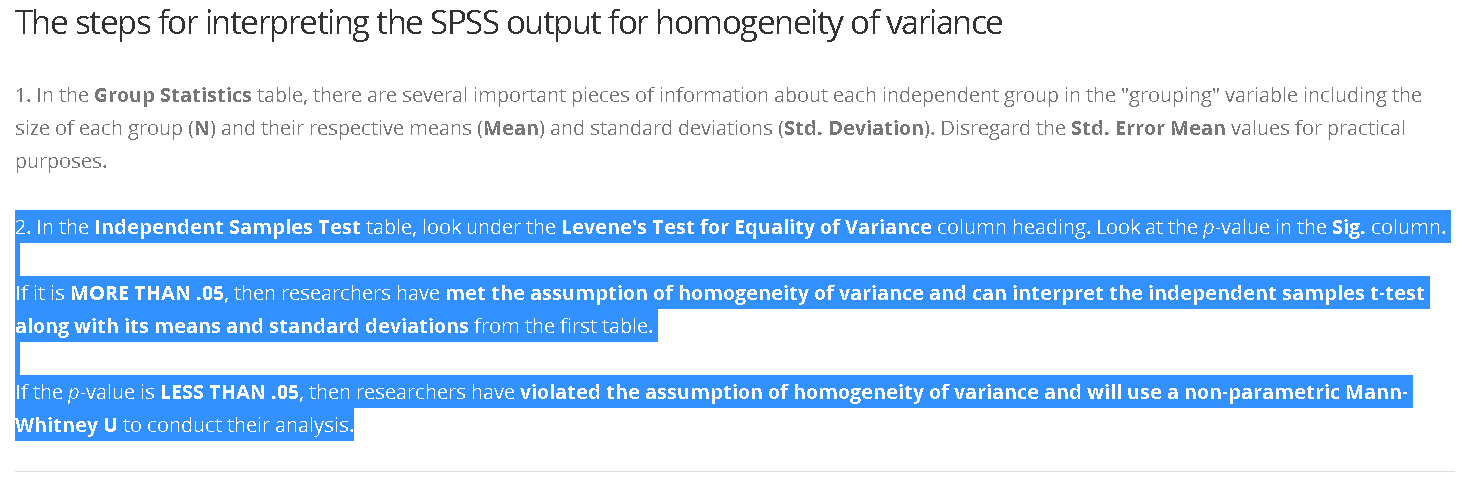
5. Analiz birimi, SPSS uygulaması: T-Testi
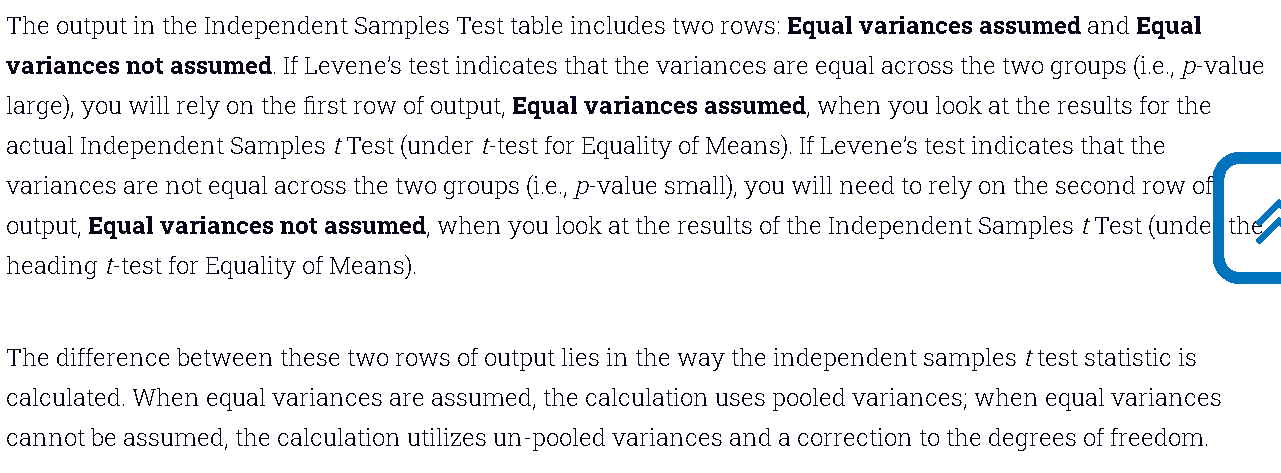
If the Levene's Test for Equality of Variances is statistically significant, which indicates that the group variances are unequal in the population, you can correct for this violation by not using the pooled estimate for the error term for the t-statistic, but instead using an adjustment to the degrees of freedom using the Welch-Satterthwaite method. In all reality, you will probably never have heard of these adjustments because SPSS Statistics hides this information and simply labels the two options as "Equal variances assumed" and "Equal variances not assumed" without explicitly stating the underlying tests used.
The Levine’s test for equal variance (the first section of the Independent Samples Test box). If the significance level is larger than .05, you should use the first line in the output table, Equal variances assumed. If the value is .05 or lower, use the second row of results.
6. Ana kütle ve örneklem, veri toplama Teknikleri, SPSS uygulaması
7. Veri yapıları, veri kalitesi, İstatistiki analizler, SPSS uygulaması
9. Bulgular ve değerlendirme , Zaman ve bütçe planlaması, SPSS uygulaması
10. Faktör analizi Güvenilirlik, SPSS uygulaması
11. Faktör analizi Geçerlilik, SPSS uygulaması
12. Faktör analizi, SPSS uygulaması
13. Amos, SPSS uygulaması
14. Amos, SPSS uygulaması
15. Sorular ve Açıklamaları
Yoklamada 7 imzada kalan öğrenci devam alamaz.
Sorular ve cevapları
1. Kuram, yapı, boyutlar hakkında bilgi. Bilgisayarlara SPSS yükleme talebi.
2. Araştırma türleri: tanımlayıcı, sonuç çıkarıcı, model geliştirme araştırmaları. Problem cümlesi, amaç, önem, kapsam, kısıtlar, ön kabuller, SPSS uygulaması (Anketlere ID numarası verme, Excell'de veri dosyası açma ve aktarma, değişkenlerin veri yapılarının kodlanması, negatif maddelerin tersine döndürülmesi, değişkenlere label atanması)
3. Hipotezler , SPSS uygulaması; SPSS (data screening Veri İncelemesi means checking data for errors and fixing or removing these errors -- Max-min analizi, uç değerler, outliers, boyutsal ve kompozit puanların hesaplanması. (toplam, ortalama ve faktör puanları temel alınarak) Boyutsal puanların demografik değişkenlere göre dağıtılması) Tavan, taban etkisi. Örneğin 10 maddeli ölçek için toplamlarını al. Transformada 40-50 arasını 1; 20den üçüğü 2 olarak ve 21 ila 39 arasını 3 olarak kodla frekansını al ve 1 ile 2 nin yüzdesinin %15'ten küçük olup olmadığına bak. Küçükse tavan-taban etkisi yok. 5 değil 7 dereceli ölçek kullanılması.
A completely different traditional approach would be to apply a transformation like square root, log, or inverse to try to make the data more normal. Square Root Transformation in SPSS
OUTLIERS
Tekli değişkenler için uç değerler box grafiği ile, çoklu değişkenler için uç değerler Mahalanobis D square ile
Regression/lineear menüsü ile
Bağımlı değişken stres / bağımsız değişken yaş faktörü --Save/mahalonobis/OK/ hesaplamayı yap... Maha…. verileri sütunu (d Square verileri)/ Çıktılardaki Anova tablosuna dönmemiz gerekiyor. Anova tablosundan serbestilik derecesine bakmamız gerekiyor (ki bizde 2)/ Transform/compute yeni değişken adı ver Pdegeri_forD --- Hesaplama penceresine 1- CDF.CHISQ(MAH_1,2) serbestlik derecesini yazıyoruz ok deyip hesaplıyoruz..... Sort ascendig ve p değeri 0,001'den küçük olanlar ayrık değer olarak atanır. Variable viev'de andalık hanesini 5'e çıkar ve incele. 0,001'den daha küçük değer olmadığı için ayrık değer olmadığına karar verilir. Daha sonra ….Transform-calculate -- rank/$rankcasenum / scatter x değişkeni rank y maha grafiğe çift tıkla vakaları belirle.
normallik değerlemesi
Additionally, there is an option to test for normality separately for individual groups. As in the example above, we could further investigate if the data for males and females is normally distributed.
A test of significance on "normality" is often very uninformative. With large samples
these tests almost always reject the hypothesis that sample data are from a normally
distributed population, but often the degree of non-normality is only small and has
no impact on the reliability of the statistcal analyses. Graphic methods such as q-q-
plots are often more useful. Moreover, if you perform analyses such as regression, ANOVA, t-test, then the normality of the variables is uninteresting. Instead, you would have to inspect
the distribution of the residuals (prediction errors). Even more: if you want to perform analyses such as regression, ANOVA, t-test, then with such a large sample size as yours, even a normal distribution of the residuals doesn't matter much.
http://www.talkstats.com/threads/non-normal-likert-scale-data.24598/
Normality Testing for Residuals in ANOVA using SPSS analyse/general linear model/ dependent stres/ faktör yaş *cinsiyet/save unstandardized/contineu Resudual adlı yeni bir değişken ve onun normal dağılım özelliği.
4. Hipotezler, SPSS uygulaması. normallik testleri: stem and leaf plots, normal Q-Q
Plot, box plot to determine the data skewness and kurtosis. A further manifestation of non-normality was noticed when Z-score value for each item was calculated. The verity of few cases has Z-value more than ±2 and spread over the variables. To curtail the occurrences of abnormal data in the current study the researcher decided that the data be transformed through cdfnorm. As a result after the transformation, the Skewness and Kurtosis of all the items are within the acceptable range of < 2 and < 7 respectively. For example the skewness values are all less than 1; similarly, the Kurtosis values on the other hand are less
than 2, an indication that the data is normal (see appendix III). This is in conformity with the suggestion forwarded by [2] that data transformation improves results of an abnormal data. Split file / Compare groups / descriptive analysis
5. Analiz birimi, SPSS uygulaması: T-Testi
If the Levene's Test for Equality of Variances is statistically significant, which indicates that the group variances are unequal in the population, you can correct for this violation by not using the pooled estimate for the error term for the t-statistic, but instead using an adjustment to the degrees of freedom using the Welch-Satterthwaite method. In all reality, you will probably never have heard of these adjustments because SPSS Statistics hides this information and simply labels the two options as "Equal variances assumed" and "Equal variances not assumed" without explicitly stating the underlying tests used.
The Levine’s test for equal variance (the first section of the Independent Samples Test box). If the significance level is larger than .05, you should use the first line in the output table, Equal variances assumed. If the value is .05 or lower, use the second row of results.
6. Ana kütle ve örneklem, veri toplama Teknikleri, SPSS uygulaması
7. Veri yapıları, veri kalitesi, İstatistiki analizler, SPSS uygulaması
9. Bulgular ve değerlendirme , Zaman ve bütçe planlaması, SPSS uygulaması
10. Faktör analizi Güvenilirlik, SPSS uygulaması
11. Faktör analizi Geçerlilik, SPSS uygulaması
12. Faktör analizi, SPSS uygulaması
13. Amos, SPSS uygulaması
14. Amos, SPSS uygulaması
15. Sorular ve Açıklamaları